How much electricity does a wind turbine produce? About 6,200 MWh a year on land, and up to 35,000 at sea
In 2025, the average wind turbine on a US wind farm made 6,173 MWh of electricity, enough for about 600 American homes for a year. The newest, biggest ones made more than twice that, and each turbine at Hornsea 2, off the Yorkshire coast, made about 35,000 MWh.
These are measured figures, not estimates: what each wind farm actually sent to the grid. For the US, the farms' 2025 output reported to the Energy Information Administration, divided by the turbines each farm has in the US Wind Turbine Database: 1,294 wind farms with 69,590 turbines and 151.7 GW, every one that ran for the whole year and whose turbines we hold. For Britain, the metered output of its biggest offshore farms over the twelve months from November 2025 to October 2026.
Bigger turbines make much more
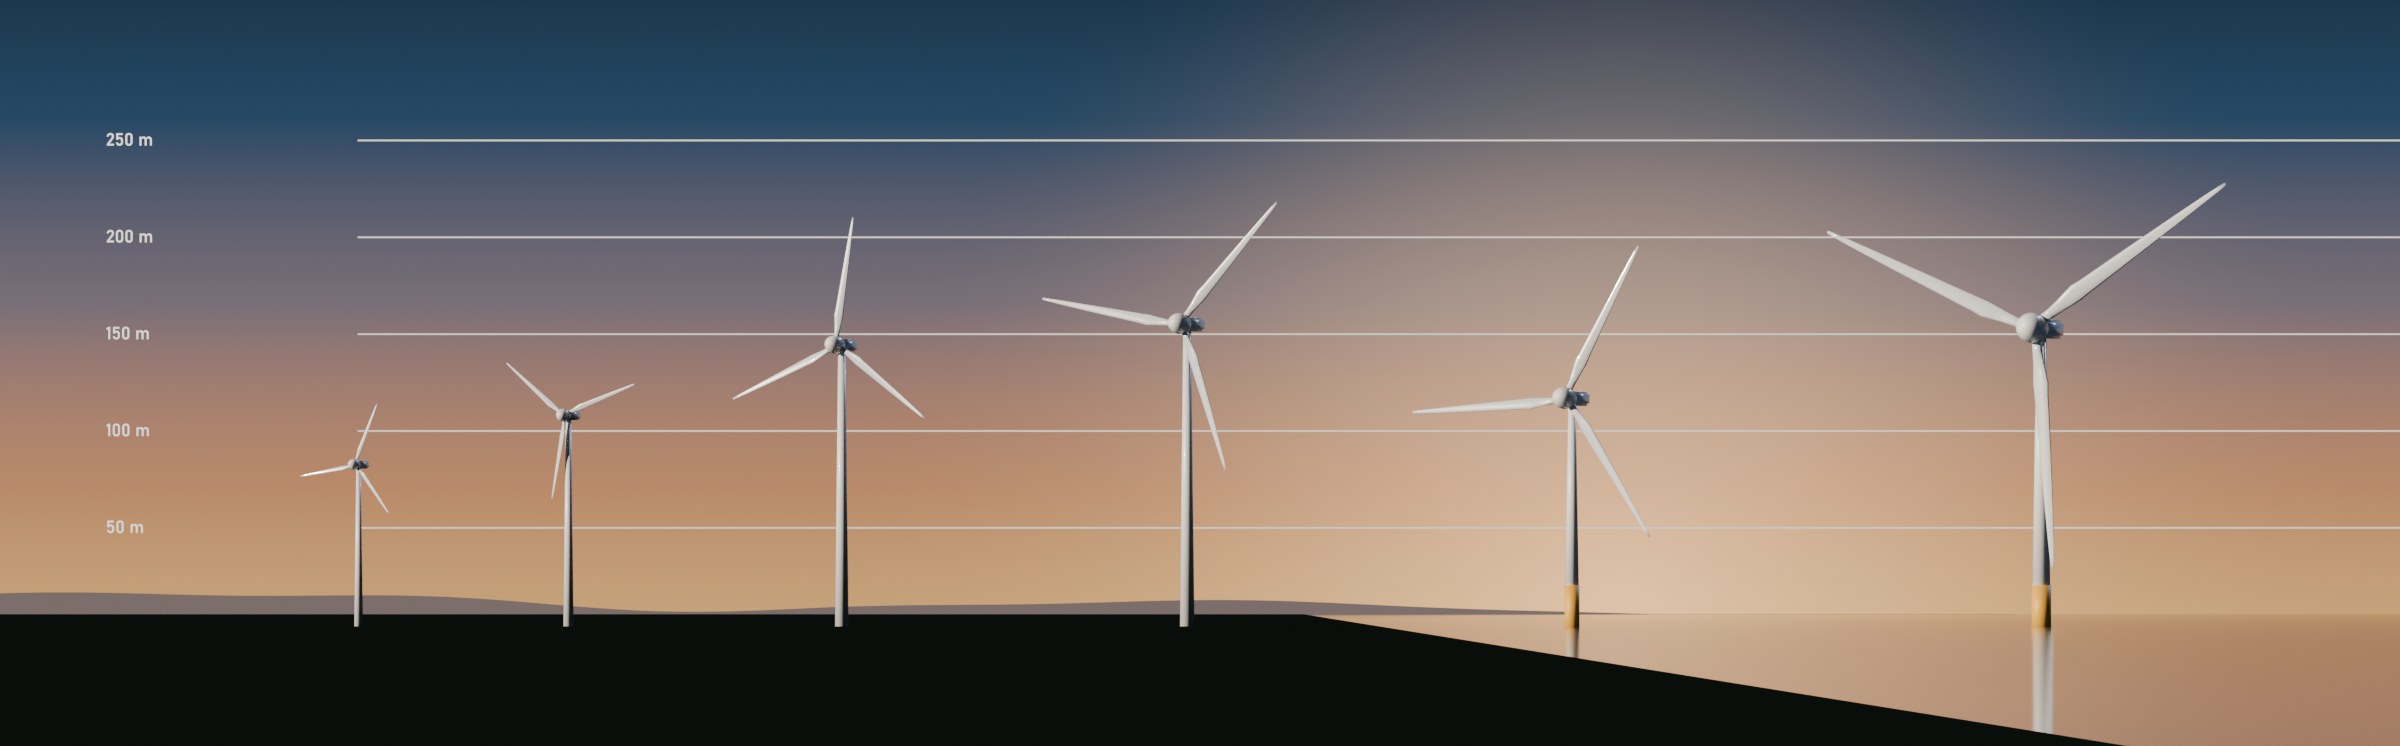
Size matters most. A turbine of up to 1.5 MW, the workhorse of the 2000s, made about 2,900 MWh in 2025. One of 2.6 to 3 MW made 8,400 MWh, and the newest, 4.6 MW and over, 13,900 MWh: almost five times as much as the oldest. A bigger turbine has longer blades that catch more wind, and sits on a taller tower where the wind is stronger and steadier (how turbines have grown).
Electricity a US wind turbine made in 2025, by turbine size
| Turbine size | Turbines | MWh a turbine | Capacity factor | US homes a turbine |
|---|---|---|---|---|
| Up to 1.5 MW | 14,744 | 2,905 | 25.8% | 280 |
| 1.6 to 2 MW | 22,959 | 5,261 | 32.5% | 507 |
| 2.1 to 2.5 MW | 14,856 | 6,926 | 33.6% | 667 |
| 2.6 to 3 MW | 10,469 | 8,416 | 33.7% | 811 |
| 3.1 to 3.5 MW | 2,541 | 9,979 | 34.2% | 961 |
| 3.6 to 4.5 MW | 2,949 | 11,783 | 34.1% | 1,135 |
| 4.6 MW and over | 1,072 | 13,860 | 31.7% | 1,335 |
Homes: EIA's average of 865 kWh a month per US household in 2024, about 10,380 kWh a year. The size of a farm's turbines is the rating it holds most of.
Why not the full amount
A 3 MW turbine running flat out all year would make 26,280 MWh: 3 MW for each of the year's 8,760 hours. In practice the wind isn't always strong enough, and turbines stop for maintenance or when the grid can't take their power. What a turbine actually makes, as a share of that maximum, is its capacity factor. For US wind it was 33.8% in 2025, by EIA's count: on average, a turbine makes about a third of what it could at full power. That's the normal figure for wind on land, and it's built into every wind farm's plans.
Apart from the oldest, smallest turbines, at 26%, the capacity factor in the table above is about a third whatever the size, yet the big turbines make far more. That's because a bigger turbine's maximum is bigger: a third of 5 MW is a lot more than a third of 1.5 MW.
At sea: 35,000 MWh a turbine
Offshore turbines are the biggest of all, and the wind at sea is stronger and steadier. Hornsea 2, off the Yorkshire coast, has 165 turbines and 1,386 MW. Over the twelve months from November 2025 to October 2026, it sent 5.79 TWh to the grid: about 35,000 MWh for each turbine, at a capacity factor of 47.7%. Each of its turbines made enough for about 14,000 British homes, which use much less electricity than American ones (Ofgem's typical household uses 2,500 kWh a year).
Older offshore turbines make less. London Array, in the Thames Estuary since 2013, has 175 turbines and 630 MW; each made about 13,200 MWh.
| Wind farm | Online | Turbines | MW | MWh a turbine | Capacity factor |
|---|---|---|---|---|---|
| Hornsea 2 | 2022 | 165 | 1,386 | 35,082 | 47.7% |
| Hornsea 1 | 2020 | 174 | 1,218 | 29,744 | 48.5% |
| Triton Knoll | 2022 | 90 | 857 | 34,314 | 41.1% |
| East Anglia ONE | 2020 | 102 | 714 | 28,239 | 46.1% |
| Walney Extension | 2018 | 87 | 659 | 31,101 | 46.9% |
| London Array | 2013 | 175 | 630 | 13,151 | 41.7% |
| Race Bank | 2018 | 91 | 573 | 24,567 | 44.5% |
| Beatrice | 2019 | 84 | 588 | 24,894 | 40.6% |
| Gwynt y Môr | 2015 | 160 | 576 | 11,712 | 37.1% |
| Greater Gabbard | 2012 | 140 | 504 | 12,218 | 38.7% |
Britain's ten offshore wind farms that sent the most to the grid over the twelve months from November 2025 to October 2026, among those running before it began. Metered output from Elexon; turbines and capacity from the government's Renewable Energy Planning Database, and the capacity factor on that capacity.
Method and sources
- US: each wind farm's 2025 net generation from EIA-923 (public domain), matched to the farm in the US Wind Turbine Database (USGS, Berkeley Lab and American Clean Power; public domain) for its turbines. Farms that came online in 2025 or later, or whose turbine count we don't hold, are left out. A farm's turbines are grouped by the rating most of them have.
- Britain: metered output at each farm's grid connection (Elexon B1610; contains BMRS data © Elexon Limited copyright and database right), November 2025 to October 2026. Turbine numbers and capacity from the Renewable Energy Planning Database (DESNZ, Open Government Licence).
- Capacity factor: output over capacity × 8,760 hours, with each farm's nameplate capacity.
- Figures as of 9 November 2026. Questions: mail@revolutionenergy.net.
Checked against published figures:
- EIA's final capacity factor for US wind in 2025 is 33.8% (Electric Power Monthly, Table 6.07.B); the farms here give 32.3%. EIA divides by summer capacity, which is a little below the nameplate capacity used here.
- Household use: EIA, 865 kWh a month per residential customer in 2024; Ofgem's typical domestic consumption value for electricity, 2,500 kWh a year from July 2026.
Free to reuse with credit. Please cite: